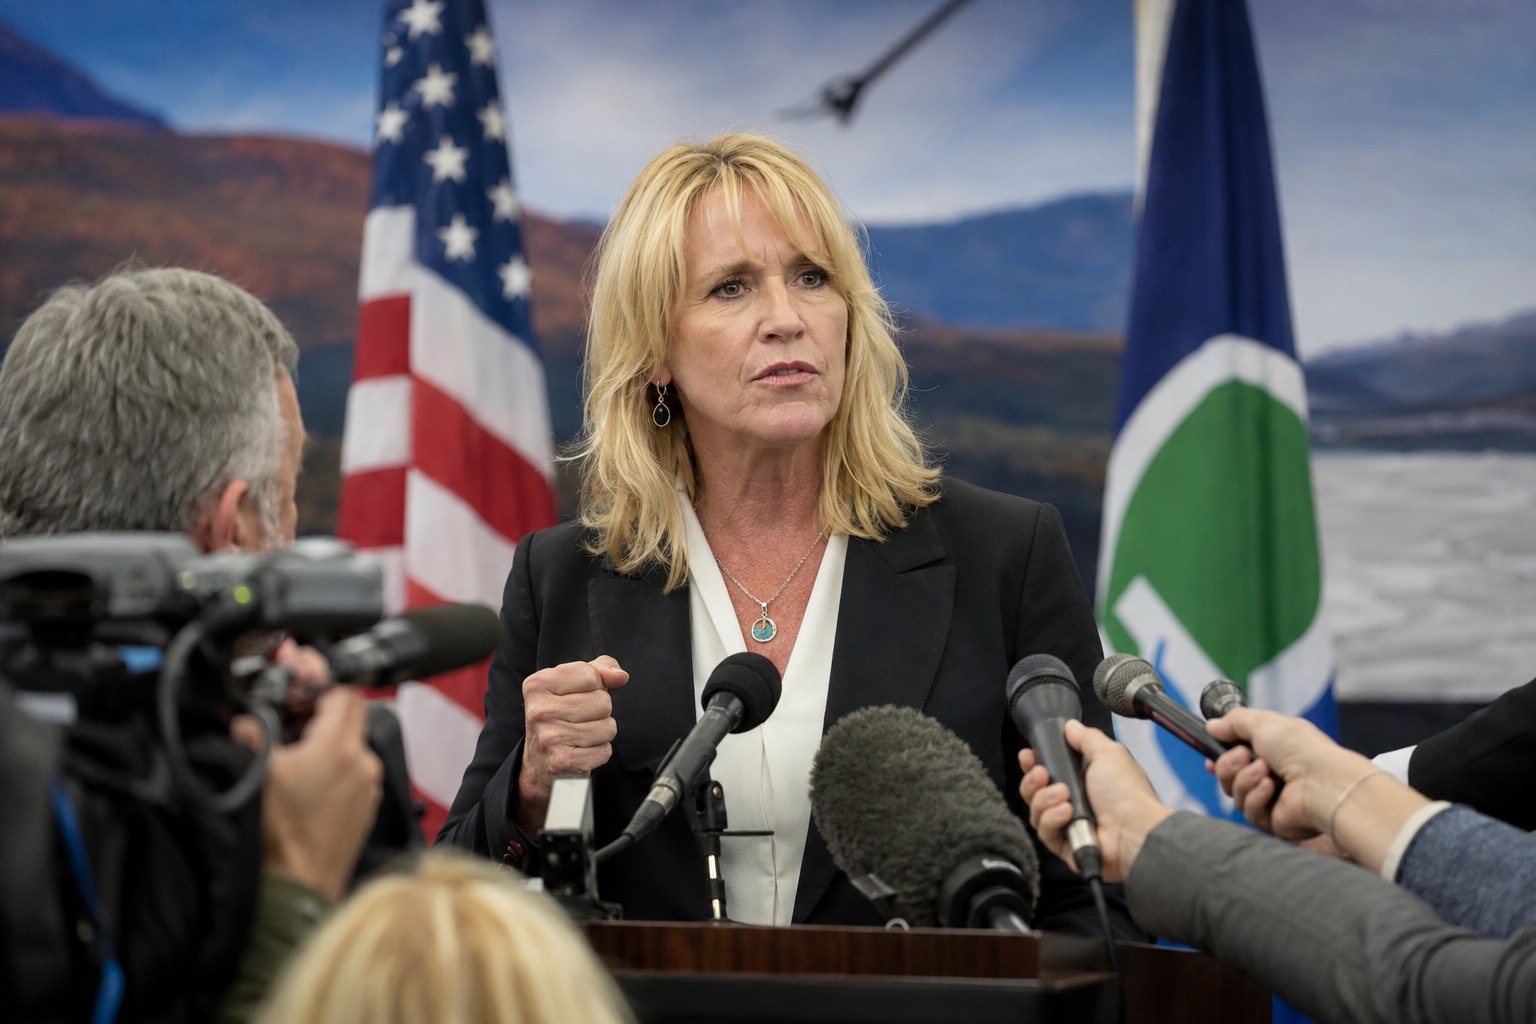
Erin Brockovich, the environmental activist whose decades-long fight against contaminated water made her a household name, has trained her sights on one of the fastest-growing industries in America: artificial intelligence data centers. She has launched a national interactive map that tracks these sprawling facilities across the country — and Americans are already flooding it with concerns.
As of late May, communities had logged concerns tied to 2,716 locations nationwide. Within the first week of the map going live, more than 1,800 reports arrived from 47 states. The tool lets residents pin locations, upload photos, and describe firsthand what is happening in their own communities.
Why a Map, and Why Now
The timing is no accident. The AI boom has triggered a construction wave of enormous computing facilities — buildings packed with servers that power everything from chatbots to image generators. These data centers are being built, proposed, or expanded at a pace that has caught many local governments off guard, and residents are increasingly asking what the facilities mean for their water, their power bills, and their quality of life.
Brockovich rose to national fame in the 1990s for her role in a landmark case involving groundwater contamination in Hinkley, California — a story later dramatized in an Oscar-winning film. Her new project applies that same instinct: give ordinary people a way to document what is happening near them and put it on the public record.
What the Map Tracks
The interactive map plots existing, proposed, and under-construction AI data centers across the United States. For each one, visitors can learn about energy use, water consumption, and electronic waste, and they can file a report about issues in their own community.
The single biggest concern reported so far is water. Large data centers can consume enormous quantities of it to keep banks of servers from overheating, and many towns worry about the strain on local supplies — especially in drought-prone regions. Right behind water came electricity, followed by health and wildlife impacts. Residents have also flagged the constant noise from cooling systems and backup generators, the mounting volume of e-waste from frequent hardware upgrades, and local infrastructure that struggles to keep pace with the demand.
The Industry’s Case — and the Pushback
The companies building these centers describe them as the backbone of the digital future — essential infrastructure for an economy increasingly running on artificial intelligence. Supporters point to jobs, tax revenue, and the strategic importance of keeping computing capacity on American soil.
Brockovich’s map reframes the conversation around a simpler question: at what cost to the people living next door? By collecting thousands of individual reports in one place, the project gives residents a collective voice that is harder to ignore than scattered complaints at city council meetings. Critics of the rapid buildout argue that local communities are being asked to shoulder the environmental burden of a national technology race without much say in the matter.
What This Means for Americans
For the average household, the stakes are concrete. A data center that draws heavily on a regional water supply or power grid can affect utility costs and reliability for everyone nearby. The map turns an abstract national trend into something local and personal — letting people see whether a facility is planned near them and what neighbors elsewhere are experiencing. Whether you view the AI expansion as progress worth the trade-offs or a strain on local resources, the tool puts the information in front of the people most affected.
Stay informed on the stories that matter most. Follow Palmedia News on Facebook and bookmark palmedianews.com for breaking news and analysis.